Fitting 2D Gaussians with agpy
Update 01/30/2014: Adam has split his gaussfitter code off into it's own GitHub repository here ("PR's Welcome!"). This removes some dependencies and changes the import statement but as of right now everything else is the same. I've maintained the old links to the original agpy repo in the post below but please use the above repo for the latest version.
After some initial work with fitting WFC3 UVIS PSFs with 1D Gaussians through the x and y axis I decided to look at 2d Guassian fitting as well. I was disappointed to find there wasn't already a canned procedure to do this in something like SciPy. But after some digging I decided to use Adam Ginsburg's personal agpy library. I briefly met Adam at the dotAstronomy conference last year in Boston. He's a contributor to AstroPY, AstroQuery, and AplPy so I had a hunch I could trust his code and it's worked out great.
You can clone the repo here. There are a couple of dependencies but I only satisfied the AstroPy and Numpy requirements and that was enough to run the gaussfit function.
from agpy import gaussfitter

mpfit, psf_fit = gaussfitter.gaussfit(psf_array, returnmp=True,
                                      returnfitimage=True)
Using gaussfit without the returnmp or returnfitimage parameters just returns a list with the following model parameters (in order):
- height
- amplitude
- x
- y
- width_x
- width_y
- rotation angle.
Adding returnfitimage=True will also return a NumPy array of the model with the same dimensions as the input data. Lastly, setting returnmp=True will return a mpfit instance, which is the class used to generate the fit. The class is defined in the agpy.mpfit_custom module. The mpfit instance contains two useful attributes, mpfit.params which is the same list of parameters that guassfit returns by default, and mpfits.covar which is a 7x7 covariance matrix for the 7 model parameters.
It took me a little bit of work to figure out all these outputs but they were exactly what I needed so I followed up with Adam and submitted my first FOSS PR on GitHub with some documentation improvements. It's a small contribution but still a personal milestone.
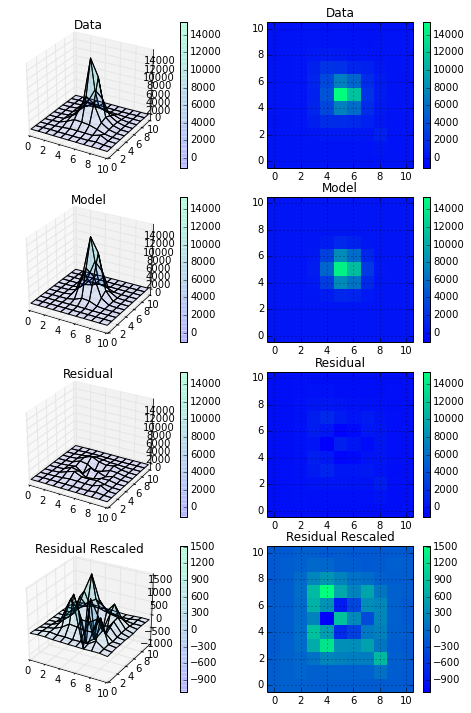
Finally, I made a plot of the input data, the model, and the residual (difference) at two different scales. I'm definitely happy with this and am looking forward to digging into the covariance matrix a little more to really understand how well I'm fitting these PSFs.